Multiple Choice
Figure 15-3 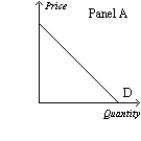

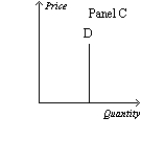
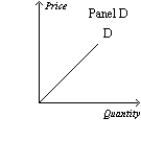
-Refer to Figure 15-3. Which panel could represent the demand curve facing the soybean industry?
A) Panel A
B) Panel B
C) Panel C
D) Panel D
Correct Answer:

Verified
Correct Answer:
Verified
Related Questions
Q152: A monopoly creates a deadweight loss to
Q201: Microsoft's government-granted exclusive right to make and
Q600: A market structure with barriers to entry
Q601: Additional firms often do not try to
Q603: Figure 15-19 <img src="https://d2lvgg3v3hfg70.cloudfront.net/TB1273/.jpg" alt="Figure 15-19
Q604: Table 15-21<br>Tommy's Tie Company, a monopolist, has
Q606: Which of the following is not a
Q608: If government officials break up a natural
Q609: Granting a pharmaceutical company a patent for
Q610: Patent and copyright laws encourage<br>A)creative activity.<br>B)lower prices