Multiple Choice
Figure 15-3 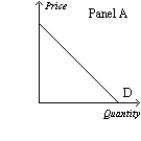

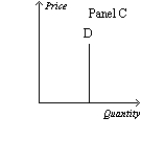
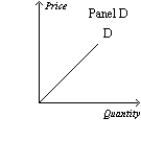
-Refer to Figure 15-3. Which panel could represent the demand curve facing a local cable television provider if that firm in a monopolist?
A) Panel A
B) Panel B
C) Panel C
D) Panel D
Correct Answer:

Verified
Correct Answer:
Verified
Q141: At the profit-maximizing quantity of output for
Q155: When a monopolist increases the quantity that
Q202: In order for antitrust laws to raise
Q488: Table 15-21<br>Tommy's Tie Company, a monopolist, has
Q490: When a local grocery store offers discount
Q491: Figure 15-9 <img src="https://d2lvgg3v3hfg70.cloudfront.net/TB1273/.jpg" alt="Figure 15-9
Q494: If the distribution of water is a
Q495: If the government regulates the price that
Q497: A monopolist maximizes profits by<br>A)producing an output
Q498: Table 15-8<br>The following table provides information on