Multiple Choice
Figure 15-4 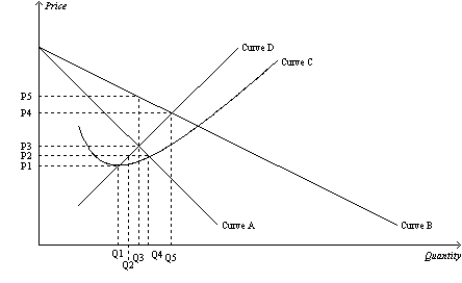
-Refer to Figure 15-4. The demand curve for a monopoly firm is depicted by curve
A) A.
B) B.
C) C.
D) D.
Correct Answer:

Verified
Correct Answer:
Verified
Q185: Figure 15-3 <img src="https://d2lvgg3v3hfg70.cloudfront.net/TB1273/.jpg" alt="Figure 15-3
Q186: Scenario 15-1<br>Vincent operates a scenic tour business
Q187: Figure 15-22<br>The diagram depicts the market situation
Q188: The process of buying a good in
Q189: With perfect price discrimination the monopoly<br>A)eliminates all
Q191: Figure 15-17 <img src="https://d2lvgg3v3hfg70.cloudfront.net/TB1273/.jpg" alt="Figure 15-17
Q192: Economic welfare is generally measured by (i)<br>Profit.<br>(ii)<br>Total
Q193: A rational pricing strategy for a profit-maximizing
Q194: Figure 15-8 <img src="https://d2lvgg3v3hfg70.cloudfront.net/TB1273/.jpg" alt="Figure 15-8
Q195: The assessment by George Stigler concerning the