Multiple Choice
Figure 14-6
Suppose a firm operating in a competitive market has the following cost curves: 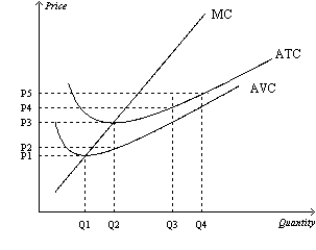
-Refer to Figure 14-6. When market price is P3, a profit-maximizing firm's profit
A) can be represented by the area P3 × Q3.
B) can be represented by the area P3 × Q2.
C) can be represented by the area (P3-P2) × Q3.
D) is zero.
Correct Answer:

Verified
Correct Answer:
Verified
Q64: Describe the difference between average revenue and
Q92: A competitive market will typically experience entry
Q547: Table 14-9<br>Suppose that a firm in a
Q548: Scenario 14-2<br>Assume a certain firm is producing
Q550: A certain competitive firm sells its output
Q551: Suppose a profit-maximizing firm in a competitive
Q553: In a competitive market the current price
Q554: In the short run, there are 500
Q555: In the short run, there are 500
Q557: Figure 14-2<br>Suppose a firm operating in a