Multiple Choice
Table 14-1 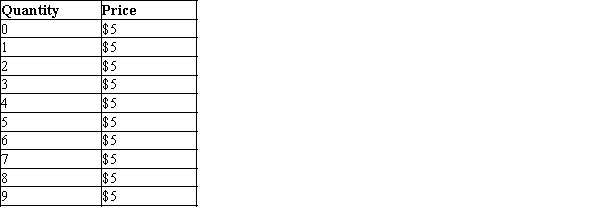
-Refer to Table 14-1. The price and quantity relationship in the table is most likely a demand curve faced by a firm in a
A) monopoly.
B) concentrated market.
C) competitive market.
D) strategic market.
Correct Answer:

Verified
Correct Answer:
Verified
Related Questions
Q165: Table 14-3<br>The table represents a demand curve
Q166: Table 14-9<br>Suppose that a firm in a
Q168: Figure 14-1<br>Suppose that a firm in a
Q169: Suppose that a firm operating in perfectly
Q171: Figure 14-5<br>Suppose a firm operating in a
Q172: Scenario 14-1<br>Assume a certain firm in a
Q173: Table 14-17<br>The table below shows the price
Q174: Competitive firms that earn a loss in
Q175: In the long-run equilibrium of a competitive
Q183: For an individual firm operating in a