Multiple Choice
Table 14-2
The table represents a demand curve faced by a firm in a competitive market. 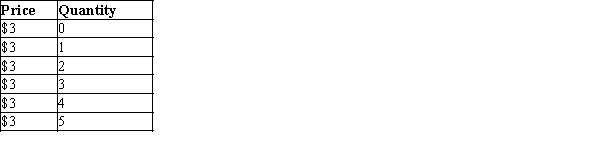
-Refer to Table 14-2. For this firm, the average revenue from selling 3 units is
A) $12.
B) $4.
C) $3.
D) $1.
Correct Answer:

Verified
Correct Answer:
Verified
Related Questions
Q6: A golf course in Fargo, North Dakota
Q8: A dairy farmer must be able to
Q128: Firms in a competitive market are said
Q384: When new firms enter a perfectly competitive
Q385: Suppose a firm in a competitive market
Q386: In the short run, a firm operating
Q390: Figure 14-14 <img src="https://d2lvgg3v3hfg70.cloudfront.net/TB1273/.jpg" alt="Figure 14-14
Q391: A profit-maximizing firm will shut down in
Q392: Consider a firm operating in a perfectly
Q393: In the short run, a market consists