True/False
Table 13-20
Listed in the table are the long-run total costs for three different firms. 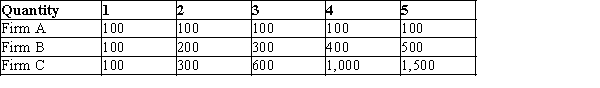
-Refer to Table 13-20. Firm C is experiencing diseconomies of scale.
Correct Answer:

Verified
Correct Answer:
Verified
Q244: The average fixed cost curve<br>A)always declines with
Q609: Figure 13-9<br>The figure below depicts average total
Q610: Table 13-16 <img src="https://d2lvgg3v3hfg70.cloudfront.net/TB1273/.jpg" alt="Table 13-16
Q611: Suppose that for a particular firm the
Q613: Suppose that a firm's long-run average total
Q615: In his book, An Inquiry into the
Q616: Economic profit is equal to total revenue
Q617: Table 13-1 <img src="https://d2lvgg3v3hfg70.cloudfront.net/TB1273/.jpg" alt="Table 13-1
Q618: Figure 13-5 <img src="https://d2lvgg3v3hfg70.cloudfront.net/TB1273/.jpg" alt="Figure 13-5
Q619: When the marginal product of an input