Multiple Choice
Figure 13-10 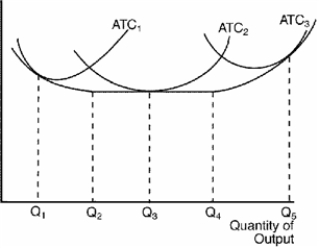
-Refer to Figure 13-10. The three average total cost curves on the diagram labeled ATC1, ATC2, and ATC3 most likely correspond to three different
A) time horizons.
B) products.
C) firms.
D) factory sizes.
Correct Answer:

Verified
Correct Answer:
Verified
Q57: Table 13-7<br>The following table shows the
Q181: The graph of the production function plots
Q470: In the long run a company that
Q471: Scenario 13-18<br>Farmer Jack is a watermelon farmer.
Q472: Table 13-15 <img src="https://d2lvgg3v3hfg70.cloudfront.net/TB1273/.jpg" alt="Table 13-15
Q473: Scenario 13-11<br>Walter builds birdhouses. He spends $5
Q476: The nature of a firm's cost (fixed
Q477: Table 13-18 <img src="https://d2lvgg3v3hfg70.cloudfront.net/TB1273/.jpg" alt="Table 13-18
Q478: Tony's Taco Truck has an average variable
Q479: Chloe's Café sells gourmet cinnamon rolls. In