Multiple Choice
Figure 13-7 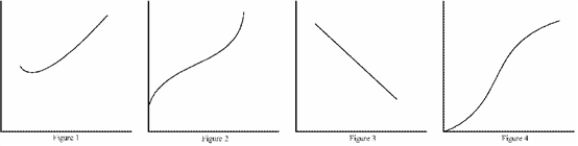
-Refer to Figure 13-7. Which of the figures represents the total cost curve for a typical firm?
A) Figure 1
B) Figure 2
C) Figure 3
D) Figure 4
Correct Answer:

Verified
Correct Answer:
Verified
Q42: Table 13-17<br>Consider the following table of long-run
Q42: Which of the following statements is correct?<br>A)Assuming
Q43: Scenario 13-9<br>Ellie has been working for an
Q44: Economies of scale occur when a firm's<br>A)marginal
Q45: If the total cost curve gets steeper
Q46: Explicit costs<br>A)require an outlay of money by
Q49: Table 13-1 <img src="https://d2lvgg3v3hfg70.cloudfront.net/TB1273/.jpg" alt="Table 13-1
Q51: Table 13-7<br>The Flying Elvis Copter Rides <img
Q52: Scenario 13-9<br>Ellie has been working for an
Q247: Diseconomies of scale often arise because higher