Multiple Choice
Figure 1
b.
Figure 2
c.
Figure 3
d.
Figure 4
ANSWER:
d
DIFFICULTY:
Moderate
LEARNING OBJECTIVES:
ECON.MANK.174 - Given a graph of the production function and input costs, derive the firm's total-cost curve.
TOPICS:
Producer theory
Production function
KEYWORDS:
BLOOM'S: Comprehension
CUSTOM ID:
178.13.3 - MC - MANK08
Figure 13-8 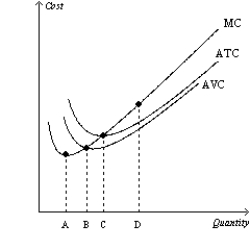
-Refer to Figure 13-8. The efficient scale of production occurs at which quantity?
A) A
B) B
C) C
D) D
Correct Answer:

Verified
Correct Answer:
Verified
Q33: Describe how a study group of economics
Q50: Table 13-4<br>The following table shows the
Q154: Describe how an accounting firm could experience
Q573: Table 13-6<br>Wooden Chair Factory <img src="https://d2lvgg3v3hfg70.cloudfront.net/TB1273/.jpg" alt="Table
Q574: Stick Storage manufactures and sells computer flash
Q575: The marginal product of labor can be
Q577: Table 13-6<br>Wooden Chair Factory <img src="https://d2lvgg3v3hfg70.cloudfront.net/TB1273/.jpg" alt="Table
Q579: Marginal cost tells us the<br>A)value of all
Q581: Profit is defined as<br>A)net revenue minus depreciation.<br>B)total
Q583: A production function is a relationship between