Multiple Choice
Figure 1
b.
Figure 2
c.
Figure 3
d.
Figure 4
ANSWER:
d
DIFFICULTY:
Moderate
LEARNING OBJECTIVES:
ECON.MANK.174 - Given a graph of the production function and input costs, derive the firm's total-cost curve.
TOPICS:
Producer theory
Production function
KEYWORDS:
BLOOM'S: Comprehension
CUSTOM ID:
178.13.3 - MC - MANK08
Figure 13-8 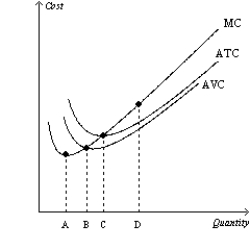
-Refer to Figure 13-8. Quantity B represents the output level where the firm
A) maximizes profits.
B) minimizes average variable costs.
C) produces at the efficient scale.
D) minimizes marginal costs.
Correct Answer:

Verified
Correct Answer:
Verified
Q3: What might cause economies of scale?
Q86: Variable costs equal fixed costs when nothing
Q113: Figure 13-10 <img src="https://d2lvgg3v3hfg70.cloudfront.net/TB1273/.jpg" alt="Figure 13-10
Q114: The marginal product of any input is
Q115: When adding another unit of labor leads
Q117: Scenario 13-4<br>Suppose that Abdul opens a coffee
Q120: Larry's Lunchcart is a small street vendor
Q121: Table 13-14 <img src="https://d2lvgg3v3hfg70.cloudfront.net/TB1273/.jpg" alt="Table 13-14
Q123: Cindy's Car Wash has average variable costs
Q242: Suppose that for a particular business there