Multiple Choice
Figure 1
b.
Figure 2
c.
Figure 3
d.
Figure 4
ANSWER:
d
DIFFICULTY:
Moderate
LEARNING OBJECTIVES:
ECON.MANK.174 - Given a graph of the production function and input costs, derive the firm's total-cost curve.
TOPICS:
Producer theory
Production function
KEYWORDS:
BLOOM'S: Comprehension
CUSTOM ID:
178.13.3 - MC - MANK08
Figure 13-8 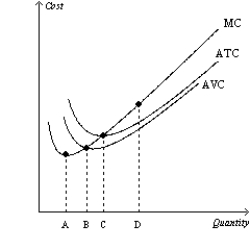
-Refer to Figure 13-8. Which of the following statements is correct?
A) Average total cost is rising for quantities higher than D because marginal cost is higher than average total cost.
B) Average variable cost is declining for quantities less than B because marginal cost is lower than average variable cost.
C) Average variable cost is minimized at B because at that quantity, marginal cost equals average variable cost.
D) All of the above are correct.
Correct Answer:

Verified
Correct Answer:
Verified
Q35: Can economic profit ever exceed accounting profit?
Q239: Describe the difference between the short run
Q418: In the long run, when marginal cost
Q419: Scenario 13-8<br>Wanda owns a lemonade stand. She
Q420: Table 13-19 <img src="https://d2lvgg3v3hfg70.cloudfront.net/TB1273/.jpg" alt="Table 13-19
Q424: Scenario 13-20<br>Suppose that a given firm experiences
Q425: Table 13-3 <img src="https://d2lvgg3v3hfg70.cloudfront.net/TB1273/.jpg" alt="Table 13-3
Q426: Scenario 13-8<br>Wanda owns a lemonade stand. She
Q427: Table 13-14 <img src="https://d2lvgg3v3hfg70.cloudfront.net/TB1273/.jpg" alt="Table 13-14
Q428: If marginal cost is greater than average