Multiple Choice
Figure 13-2 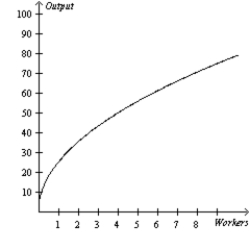
-Refer to Figure 13-2. The graph illustrates a typical
A) total-cost curve.
B) production function.
C) production possibilities frontier.
D) marginal product of labor curve.
Correct Answer:

Verified
Correct Answer:
Verified
Q7: The most likely explanation for economies of
Q79: Economists and accountants both include forgone income
Q102: Describe the general shape of the average-fixed-cost
Q357: Table 13-15 <img src="https://d2lvgg3v3hfg70.cloudfront.net/TB1273/.jpg" alt="Table 13-15
Q359: Scenario 13-17<br>If Farmer Brown plants no seeds
Q361: Suppose Jan started up a small lemonade
Q363: Table 13-19 <img src="https://d2lvgg3v3hfg70.cloudfront.net/TB1273/.jpg" alt="Table 13-19
Q364: In the long run a company that
Q365: The marginal cost curve crosses the average
Q367: The Big Blue Sky jet company has