Multiple Choice
Figure 13-2 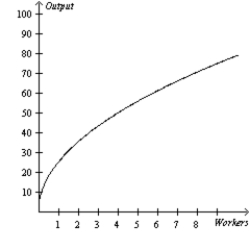
-Refer to Figure 13-2. The graph illustrates a typical production function. Based on its shape, what does the corresponding total cost curve look like?
A) an upward-sloping curve that increases at an increasing rate
B) an upward-sloping curve that increases at a decreasing rate
C) a downward-sloping curve
D) a horizontal straight line
Correct Answer:

Verified
Correct Answer:
Verified
Q103: Table 13-8<br><br><br> <span class="ql-formula" data-value="\begin{array}
Q162: Table 13-6<br>Wooden Chair Factory <img src="https://d2lvgg3v3hfg70.cloudfront.net/TB1273/.jpg" alt="Table
Q163: Which of the following is an example
Q164: Table 13-14 <img src="https://d2lvgg3v3hfg70.cloudfront.net/TB1273/.jpg" alt="Table 13-14
Q165: Which of the following must always be
Q166: Table 13-14 <img src="https://d2lvgg3v3hfg70.cloudfront.net/TB1273/.jpg" alt="Table 13-14
Q168: Average total cost is equal to<br>A)output/total cost.<br>B)total
Q169: Scenario 13-6<br>Ziva is an organic lettuce farmer,
Q170: A firm has a fixed cost of
Q172: Scenario 13-21<br>Suppose that a small family farm