Multiple Choice
Figure 13-3 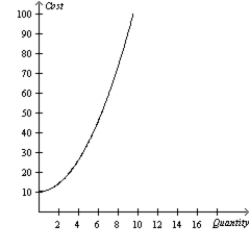
-Refer to Figure 13-3. The graph illustrates a typical total cost curve. Based on its shape, what does the corresponding production function look like?
A) an upward-sloping curve that increases at an increasing rate
B) an upward-sloping curve that increases at a decreasing rate
C) a downward-sloping curve
D) a horizontal straight line
Correct Answer:

Verified
Correct Answer:
Verified
Q155: Firms may experience diseconomies of scale when<br>A)they
Q165: Jane was a partner at a law
Q211: Average total cost is very high when
Q558: Pete owns a shoe-shine business. His accountant
Q560: The things that must be forgone to
Q563: Table 13-11 <img src="https://d2lvgg3v3hfg70.cloudfront.net/TB1273/.jpg" alt="Table 13-11
Q564: Table 13-5 <img src="https://d2lvgg3v3hfg70.cloudfront.net/TB1273/.jpg" alt="Table 13-5
Q565: Figure 13-3 <img src="https://d2lvgg3v3hfg70.cloudfront.net/TB1273/.jpg" alt="Figure 13-3
Q566: Table 13-20<br>Listed in the table are the
Q567: Table 13-18 <img src="https://d2lvgg3v3hfg70.cloudfront.net/TB1273/.jpg" alt="Table 13-18