menu-iconExamlexExamLexServices

Discover

Ask a Question
  1. All Topics
  2. Topic
    Business
  3. Study Set
    Principles of Microeconomics Study Set 10
  4. Exam
    Exam 10: Externalities
  5. Question
    Figure 10-13
Solved

Figure 10-13

Question 363

Question 363

Multiple Choice

Figure 10-13. On the graph, Q represents the quantity of plastics and P represents the price of plastics. Figure 10-13. On the graph, Q represents the quantity of plastics and P represents the price of plastics.   -Refer to Figure 10-13. Each unit of plastics that is produced results in an external A) cost of $6. B) cost of $8. C) benefit of $6. D) benefit of $8.
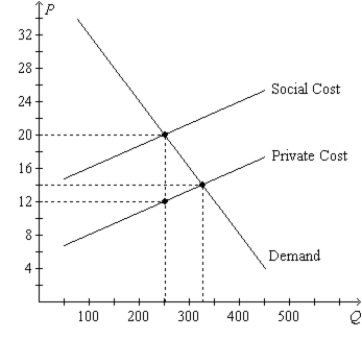
-Refer to Figure 10-13. Each unit of plastics that is produced results in an external


A) cost of $6.
B) cost of $8.
C) benefit of $6.
D) benefit of $8.

Correct Answer:

verifed

Verified

Unlock this answer now
Get Access to more Verified Answers free of charge

Related Questions

Q19: In some situations, private economic actors cannot

Q162: The patent system gives firms greater incentive

Q163: Research into new technologies conveys neither negative

Q358: William engages in an activity that influences

Q360: Figure 10-19 <img src="https://d2lvgg3v3hfg70.cloudfront.net/TB1273/.jpg" alt="Figure 10-19

Q362: Figure 10-4 <img src="https://d2lvgg3v3hfg70.cloudfront.net/TB1273/.jpg" alt="Figure 10-4

Q364: Figure 10-12 <img src="https://d2lvgg3v3hfg70.cloudfront.net/TB1273/.jpg" alt="Figure 10-12

Q366: By allowing an income-tax deduction for charitable

Q367: Assuming transaction costs are small, the Coase

Q368: Corrective taxes are unlike most other taxes

Examlex

ExamLex

About UsContact UsPerks CenterHomeschoolingTest Prep

Work With Us

Campus RepresentativeInfluencers

Links

FaqPricingChrome Extension

Download The App

Get App StoreGet Google Play

Policies

Privacy PolicyTerms of ServiceHonor CodeCommunity Guidelines

Scan To Download

qr-code

Copyright © (2025) ExamLex LLC.

Privacy PolicyTerms Of ServiceHonor CodeCommunity Guidelines