Multiple Choice
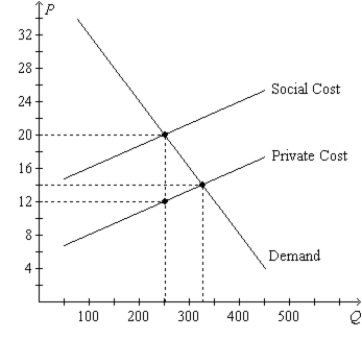
Figure 10-13. On the graph, Q represents the quantity of plastics and P represents the price of plastics. 
-Refer to Figure 10-13. If 250 units of plastics are produced and consumed, then the
A) social optimum has been reached.
B) market equilibrium has been reached.
C) negative externality associated with plastics has been eliminated.
D) positive externality associated with plastics has been eliminated.
Correct Answer:

Verified
Correct Answer:
Verified
Q99: Organizers of an outdoor concert in a
Q176: When technology spillover occurs,<br>A)it is the government's
Q177: Figure 10-12 <img src="https://d2lvgg3v3hfg70.cloudfront.net/TB1273/.jpg" alt="Figure 10-12
Q178: Which of the following statements is not
Q180: Figure 10-6 <img src="https://d2lvgg3v3hfg70.cloudfront.net/TB1273/.jpg" alt="Figure 10-6
Q182: Which of the following is NOT a
Q183: Suppose that large-scale pork production has the
Q184: Suppose that smoking creates a negative externality.
Q185: Corrective taxes that are imposed upon the
Q186: Figure 10-12 <img src="https://d2lvgg3v3hfg70.cloudfront.net/TB1273/.jpg" alt="Figure 10-12