Multiple Choice
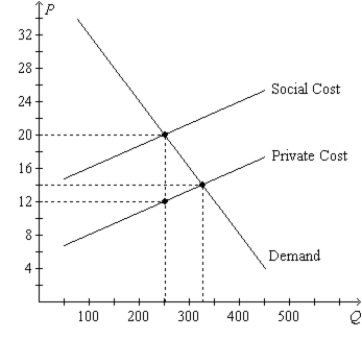
Figure 10-13. On the graph, Q represents the quantity of plastics and P represents the price of plastics. 
-Refer to Figure 10-13. If 325 units of plastics are produced and consumed, then the
A) social optimum has been reached.
B) market equilibrium has been reached.
C) government must have imposed a corrective tax to guide the market to this outcome.
D) government must have offered a corrective subsidy to guide the market to this outcome.
Correct Answer:

Verified
Correct Answer:
Verified
Q110: Suppose that candy producers create a positive
Q119: A rain barrel is a container that
Q121: Figure 10-9 <img src="https://d2lvgg3v3hfg70.cloudfront.net/TB1273/.jpg" alt="Figure 10-9
Q122: Scenario 10-1<br>The demand curve for gasoline slopes
Q125: Which of the following policies is not
Q126: This figure reflects the market for outdoor
Q127: Which of the following statements is correct?<br>A)Taxes
Q128: Table 10-5<br>The following table shows the marginal
Q129: If an externality is present in a
Q131: According to the Coase Theorem, individuals can