Multiple Choice
Figure 10-15 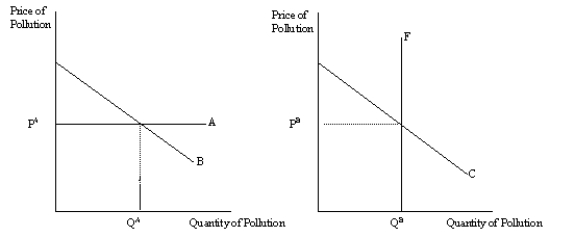
-Refer to Figure 10-15. Which graph illustrates a pollution permit program?
A) the left graph
B) the right graph
C) both graphs
D) neither graph
Correct Answer:

Verified
Correct Answer:
Verified
Q41: Does research into new technologies create a
Q116: When an externality is present, the market
Q500: For the purpose of protecting the environment,
Q501: Figure 10-16 <img src="https://d2lvgg3v3hfg70.cloudfront.net/TB1273/.jpg" alt="Figure 10-16
Q502: Suppose planting flowering shrubs creates a positive
Q503: Figure 10-15 <img src="https://d2lvgg3v3hfg70.cloudfront.net/TB1273/.jpg" alt="Figure 10-15
Q506: Figure 10-12 <img src="https://d2lvgg3v3hfg70.cloudfront.net/TB1273/.jpg" alt="Figure 10-12
Q507: Markets are often inefficient when negative externalities
Q508: Which of the following illustrates the concept
Q510: Scenario 10-2<br>The demand curve for restored historic