Multiple Choice
Figure 10-15 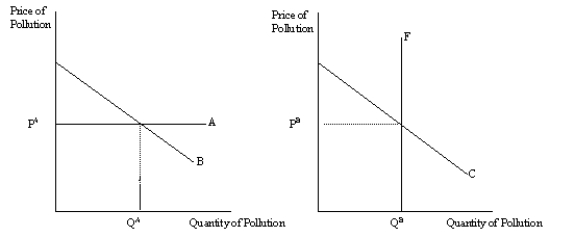
-Refer to Figure 10-15. Which graph illustrates a corrective tax?
A) the left graph
B) the right graph
C) both graphs
D) neither graph
Correct Answer:

Verified
Correct Answer:
Verified
Q62: Table 10-3<br><br><br> <span class="ql-formula" data-value="\begin{array}
Q122: The likelihood of successful private solutions to
Q187: Firms that are involved in more than
Q188: Alexander lives in an apartment building and
Q189: Wally owns a dog whose barking annoys
Q190: Suppose that flower gardens create a positive
Q191: Figure 10-20. <img src="https://d2lvgg3v3hfg70.cloudfront.net/TB1273/.jpg" alt="Figure 10-20.
Q193: Dog owners do not bear the full
Q194: In the case of a technology spillover,
Q195: Figure 10-11 <img src="https://d2lvgg3v3hfg70.cloudfront.net/TB1273/.jpg" alt="Figure 10-11