Multiple Choice
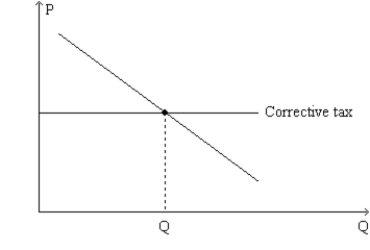
Figure 10-18. The graph represents a corrective tax to reduce pollution. On the axes, Q denotes the quantity of pollution and P represents the price of pollution. 
-Refer to Figure 10-18. What is the appropriate label for the downward-sloping line on the graph?
A) "Demand for clean air"
B) "Demand for pollution rights"
C) "Supply of pollution permits"
D) "Tax paid to government"
Correct Answer:

Verified
Correct Answer:
Verified
Q63: Scenario 10-3<br><br>Suppose the equation for the
Q386: Which of the following statements is correct
Q387: Figure 10-20. <img src="https://d2lvgg3v3hfg70.cloudfront.net/TB1273/.jpg" alt="Figure 10-20.
Q388: Emission controls on automobiles are an example
Q389: Table 10-4 <img src="https://d2lvgg3v3hfg70.cloudfront.net/TB1273/.jpg" alt="Table 10-4
Q390: In recent years, the Canadian province of
Q392: When a market is characterized by an
Q394: Scenario 10-1<br>The demand curve for gasoline slopes
Q395: Since externalities tend to keep markets from
Q396: What economic argument suggests that if transactions