Multiple Choice
Figure 10-19 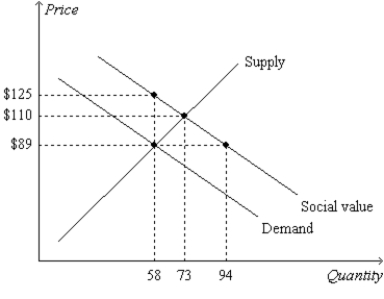
-Refer to Figure 10-19. The social optimum can be reached if
A) a subsidy of $36 is applied to each unit of the good.
B) a subsidy of $23 is applied to each unit of the good.
C) a tax of $23 is applied to each unit of the good.
D) a tax of $15 is applied to each unit of the good.
Correct Answer:

Verified
Correct Answer:
Verified
Q86: Suppose that Company A's railroad cars pass
Q95: According to the Coase theorem, the private
Q116: When an externality is present, the market
Q507: Markets are often inefficient when negative externalities
Q508: Which of the following illustrates the concept
Q510: Scenario 10-2<br>The demand curve for restored historic
Q513: A corrective tax<br>A)causes each factory to reduce
Q515: Which of the following is not correct?<br>A)Markets
Q516: Figure 10-13. On the graph, Q represents
Q517: This figure reflects the market for outdoor