Multiple Choice
Figure 10-1 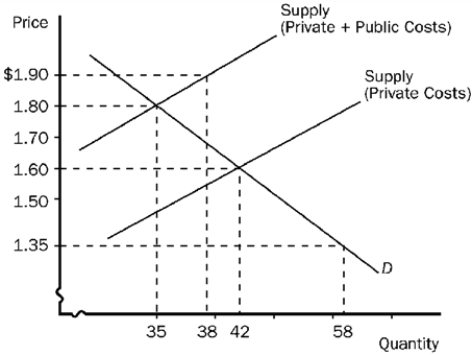
-Refer to Figure 10-1. This graph represents the tobacco industry. The socially optimal price and quantity are
A) $1.90 and 38 units, respectively.
B) $1.80 and 35 units, respectively.
C) $1.60 and 42 units, respectively.
D) $1.35 and 58 units, respectively.
Correct Answer:

Verified
Correct Answer:
Verified
Related Questions
Q68: The Coase theorem asserts that the private
Q69: Suppose that flu shots create a positive
Q72: Which of the following best defines the
Q74: Suppose the socially-optimal quantity of good x
Q75: Which of the following require firms to
Q77: Flu shots provide a positive externality. Suppose
Q78: Which of the following is an advantage
Q93: Sheryl sits on her patio and plays
Q144: To determine the optimal level of output
Q193: Assume each gallon of gasoline that is