Multiple Choice
Figure 10-2. The graph depicts the market for plastic. 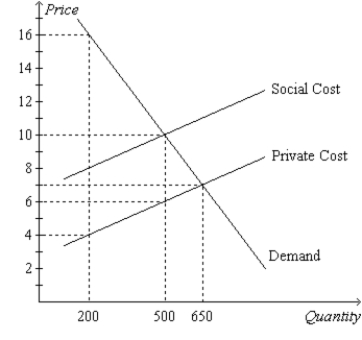
-Refer to Figure 10-2. Suppose that the production of plastic creates a social cost which is depicted in the graph above. What is the socially optimal quantity of plastic?
A) 200 units
B) 450 units
C) 500 units
D) 650 units
Correct Answer:

Verified
Correct Answer:
Verified
Q12: When a transaction between a buyer and
Q28: Two types of private solutions to the
Q455: Figure 10-4 <img src="https://d2lvgg3v3hfg70.cloudfront.net/TB1273/.jpg" alt="Figure 10-4
Q456: Two firms, A and B, each currently
Q457: Cameron lives in an apartment building and
Q458: All externalities<br>A)cause markets to fail to allocate
Q459: Private solutions may not be possible due
Q461: If the government were to impose a
Q462: Dioxin emission that results from the production
Q464: An externality arises when a person engages