Multiple Choice
Figure 10-9 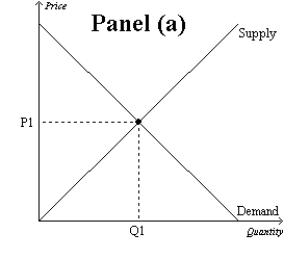
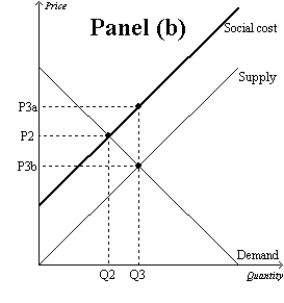
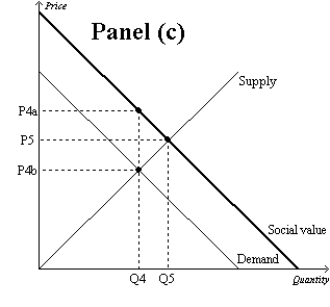
-Refer to Figure 10-9. Which graph represents a market with a positive externality?
A) Panel (a)
B) Panel (b)
C) Panel (c)
D) Both (b) and (c) are correct.
Correct Answer:

Verified
Correct Answer:
Verified
Q36: Briefly explain how research into new technologies
Q72: The Coase theorem suggests that taxes should
Q81: To produce honey, beekeepers place hives of
Q139: Government intervention is necessary to correct all
Q205: Market failure can be caused by<br>A)too much
Q207: In what sense do externalities cause the
Q208: In the absence of externalities, the "invisible
Q210: Figure 10-11 <img src="https://d2lvgg3v3hfg70.cloudfront.net/TB1273/.jpg" alt="Figure 10-11
Q213: When the government uses a command-and-control policy
Q214: When negative externalities are present in a