Essay
Pop-up coffee vendors have been popular in the city of Adelaide in 2013. A vendor is interested in knowing how temperature (in degrees Celsius) and number of different pastries and biscuits offered to customers impacts daily hot coffee sales revenue (in $00's).
A random sample of 6 days was taken, with the daily hot coffee sales revenue and the corresponding temperature and number of different pastries and biscuits offered on that day, noted.
Describe the following scatterplots. 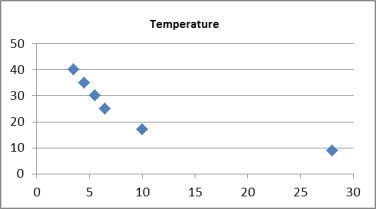 Scatterplot of Daily hot coffee sales revenue vs Temperature
 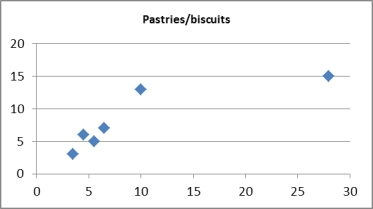 Scatterplot of Daily hot coffee sales revenue Pastries/biscuits
 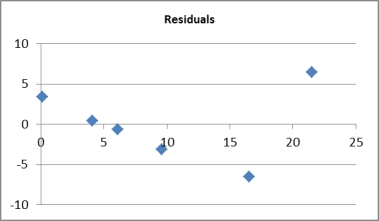 Residual scatterplot of Daily hot coffee sales revenue vs fitted values
Correct Answer:

Verified
Scatterplot of Daily hot coffee sales re...View Answer
Unlock this answer now
Get Access to more Verified Answers free of charge
Correct Answer:
Verified
View Answer
Unlock this answer now
Get Access to more Verified Answers free of charge
Q2: Given the following statistics of a
Q6: Test the hypotheses: <span class="ql-formula"
Q8: A multiple regression the coefficient of
Q9: Test the hypotheses: <span class="ql-formula"
Q10: A statistician wanted to determine whether
Q11: In multiple regression, the standard error
Q12: Excel and Minitab both provide the
Q85: Consider the following statistics of a multiple
Q99: A multiple regression analysis that includes 20
Q103: For a set of 30 data