Essay
The bar chart below is of the colour of motor vehicles in a random sample. A student commented that the distribution was negatively skewed. Explain what is wrong with this statement.
Motor Vehicle Colour Relative Frequency Bar Chart 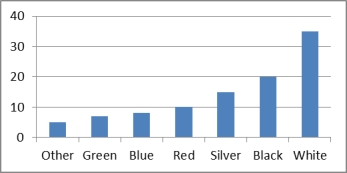
Correct Answer:

Verified
This is a bar chart, and the c...View Answer
Unlock this answer now
Get Access to more Verified Answers free of charge
Correct Answer:
Verified
View Answer
Unlock this answer now
Get Access to more Verified Answers free of charge
Q17: A stem-and-leaf display describes two-digit integers between
Q32: Which of the following statements is
Q33: If we draw a straight line through
Q34: The number of faulty items returned
Q35: Which of the following graphical display
Q36: Which of the following statements best
Q39: Which of the following best describes
Q40: When income increases, expenditure on imports
Q63: Frequency polygons are useful for obtaining a
Q82: Individual observations within each class may be