Multiple Choice
Tennenholtz Company's break-even graph is depicted below. Which area indicates the profitability of the company's product? 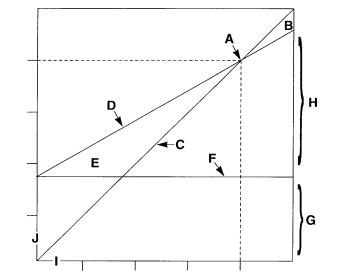
A) E.
B) G.
C) B.
D) H.
Correct Answer:

Verified
Correct Answer:
Verified
Related Questions
Q10: In performing an activity-based costing study for
Q13: Which of the following is a more
Q15: A traditional break-even chart is illustrated below:
Q15: Which of the following does not appear
Q16: Busby Company needs 10,000 units of a
Q17: Tennenholtz Company's break-even graph is depicted below.
Q19: Cleese Company currently purchases a finished part
Q20: Donellan Company produces a special gear used
Q22: Another term for cost incurred to sell
Q33: Jasper Company makes two versions of one