Multiple Choice
Which of the lines on the figure below is the best representation of the relationship between the volume of a gas and its Celsius temperature, other factors remaining constant? 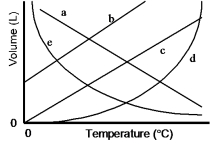
A) a
B) b
C) c
D) d
E) e
Correct Answer:

Verified
Correct Answer:
Verified
Related Questions
Q17: State Boyle's Law and illustrate it with
Q24: A sample of propane, a component of
Q27: The air pressure in a volleyball is
Q36: Select the statement which does NOT apply
Q43: For a pure gas sample, the average
Q52: A sample of nitrogen gas at 298
Q57: Hydrochloric acid is prepared by bubbling
Q60: Which of the lines on the figure
Q61: at 300. K?<br>A) 37.5 K<br>B) 75 K<br>C)
Q78: If the molecular mass of a gas