Multiple Choice
What is the shape for the distribution shown in the following graph? 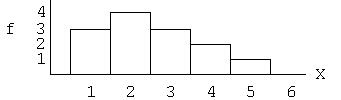
A) positively skewed
B) negatively skewed
C) symmetrical
D) normal
Correct Answer:

Verified
Correct Answer:
Verified
Related Questions
Q5: In a grouped frequency distribution one interval
Q9: If the following scores were placed
Q10: A score equal to the 5<sup>th</sup> percentile
Q12: For the following distribution, seven people
Q13: A sample of n = 15 scores
Q16: For the distribution in the following table,
Q18: For the following distribution of quiz
Q19: For the distribution in the following table,
Q34: A researcher surveys a sample of n
Q56: The scores for a very easy exam