Multiple Choice
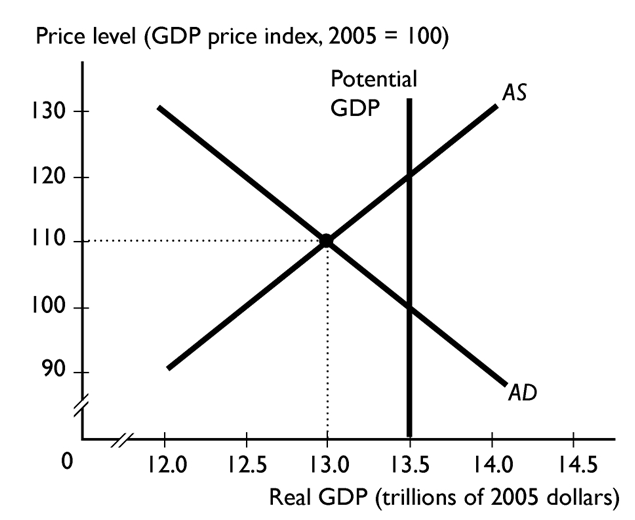
In the figure above, the economy is at an equilibrium with real GDP of $13 trillion and a price level of 110. As the economy moves toward its ultimate equilibrium, the -------------------- curve shifts-------------------- .
A) aggregate supply; leftward
B) potential GDP; leftward
C) aggregate demand; rightward
D) aggregate supply; rightward
E) aggregate demand; leftward
Correct Answer:

Verified
Correct Answer:
Verified
Q2: When the price level falls,<br>A)there is a
Q3: During the late 1960s, U.S. defense spending
Q4: <img src="https://d2lvgg3v3hfg70.cloudfront.net/TB2787/.jpg" alt=" - The aggregate
Q5: The aggregate demand curve shifts when any
Q6: As the money wage rate increases,<br>A)potential GDP
Q8: Over a business cycle, the quantities of
Q9: If the price of oil rises, the<br>A)AD
Q10: If real GDP is less than potential
Q11: According to the AS-AD model,<br>A)the AS curve
Q12: If European economies enter a recession,<br>A)the quantity