Multiple Choice
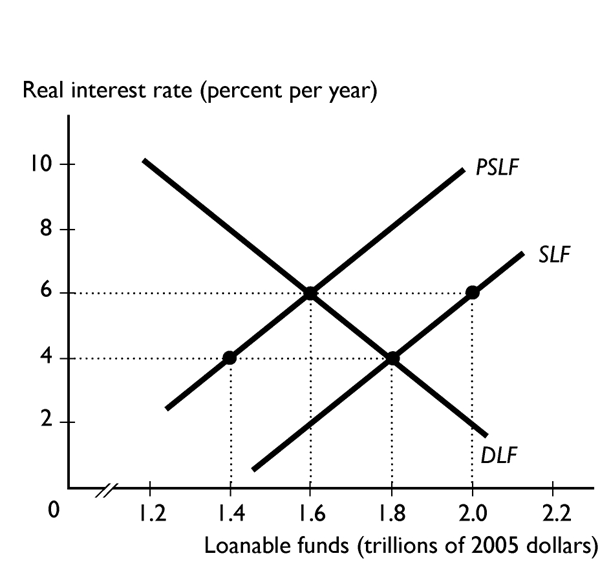
In the figure above, the SLF curve is the supply of loanable funds curve and the PSLF curve is the private supply of loanable funds curve.
- The equilibrium interest rate is -------------------- percent and the equilibrium quantity of loanable funds is-------------------- .
A) 6; $2.0 trillion
B) 6; $1.6 trillion
C) 4; $2.0 trillion
D) 4; $1.8 trillion
E) 4; $1.4 trillion
Correct Answer:

Verified
Correct Answer:
Verified
Q76: The demand for loanable funds curve illustrates<br>A)how
Q77: If there is no Ricardo-Barro effect, a
Q78: An increase in disposable income leads to
Q79: Financial capital<br>A)is accumulated investment.<br>B)depreciates each year.<br>C)is another
Q80: In which of the following cases would
Q82: Which of the following are typically financed
Q83: The change in the quantity of capital
Q84: The supply of loanable funds schedule shows
Q85: <sub>--------------------</sub>increases the quantity of capital and<sub>--------------------</sub>decreases the
Q86: In the loanable funds market, which of