Multiple Choice
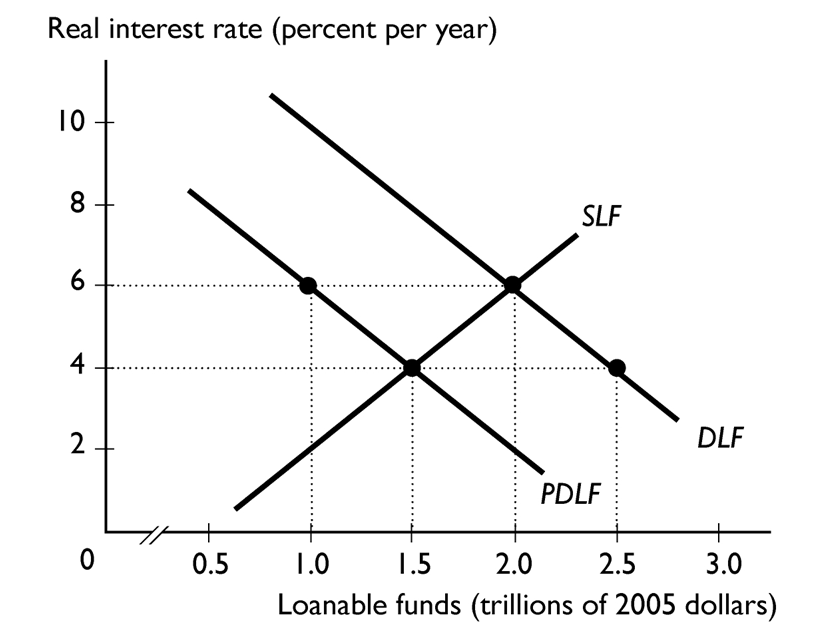
In the figure above, the DLF curve is the demand for loanable funds curve and the PDLF curve is the private demand for loanable funds curve.
- If there is no Ricardo-Barro effect, the figure shows the situation in which the government has a --------------------so that the equilibrium real interest rate is--------------------
and the equilibrium quantity of investment is-------------------- .
A) budget deficit; 4 percent; $1 trillion
B) budget deficit; 6 percent; $1.5 trillion
C) balanced budget; 6 percent; $1.5 trillion
D) budget surplus; 6 percent; $1.5 trillion
E) budget surplus; 4 percent; $1 trillion
Correct Answer:

Verified
Correct Answer:
Verified
Q134: Ford Motor Corporation is considering purchasing new
Q135: Suppose the government's budget deficit increases by
Q136: The supply of loanable funds is from<br>A)households
Q137: A stockholder<sub>--------------------</sub>an owner of the firm and
Q138: In the loanable funds market, a shortage
Q140: Which of the following are typically financed
Q141: <sub>--------------------</sub>reflects a use of loanable funds while<sub>--------------------</sub>reflects
Q142: Federal Express's purchase of trucks and planes<br>A)is
Q143: If the real interest rate rises,<br>A)the quantity
Q144: <img src="https://d2lvgg3v3hfg70.cloudfront.net/TB2787/.jpg" alt=" In the