Multiple Choice
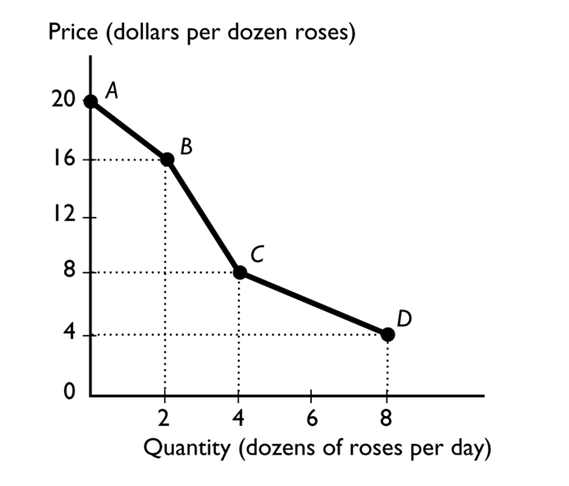
The figure above shows the relationship between the price of a dozen roses and the quantity of roses a florist can sell. The slope between points A and B is
A) 2.
B) 20.
C) 16.
D) 4
E) nonexistent because at point A, no roses are sold.
Correct Answer:

Verified
Correct Answer:
Verified
Q82: The decision to go to graduate school
Q83: Scarcity means we must<br>A)work more.<br>B)earn more.<br>C)consume less.<br>D)produce
Q84: A choice made by comparing all relevant
Q85: Jamie has enough money to buy either
Q86: Most economic graphs have two lines perpendicular
Q88: A graph that shows the value of
Q89: If a small change in the x
Q90: <img src="https://d2lvgg3v3hfg70.cloudfront.net/TB2787/.jpg" alt=" The relationship between
Q91: To economists, scarcity means that<br>A)a person looking
Q92: A time series graph<br>A)is not useful if