Multiple Choice
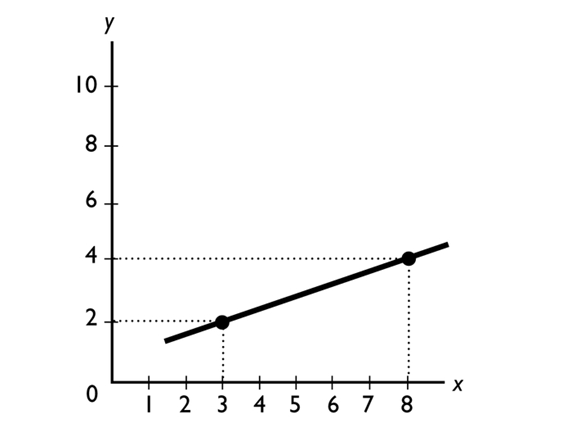
The slope of the line shown in the above figure is
A) 5/2.
B) 2/5.
C) 2/3.
D) 5.
E) 2.
Correct Answer:

Verified
Correct Answer:
Verified
Related Questions
Q113: To show how a variable <sub>--------------------</sub>, we
Q114: To graph a relationship among several variables,
Q115: When the power company decides to use
Q116: Canada has nationalized health care, so that
Q119: Which of the following is a microeconomic
Q120: <img src="https://d2lvgg3v3hfg70.cloudfront.net/TB2787/.jpg" alt=" In the above
Q121: The <sub>--------------------</sub>of something is the gain or
Q122: If the marginal benefit of the next
Q123: Consider a diagram in which the variable
Q136: <img src="https://d2lvgg3v3hfg70.cloudfront.net/TB1458/.jpg" alt=" -In the above