Multiple Choice
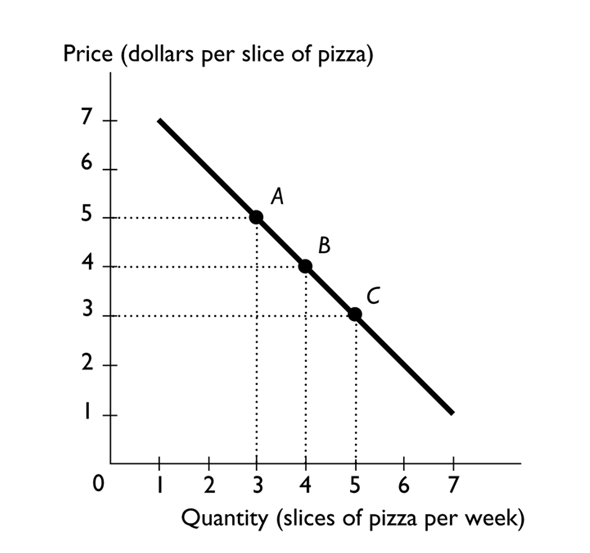
The above figure shows the relationship between the price of a slice of pizza and how many slices of pizza Ricardo buys in a week. Between points A and B, the slope of the line equals
A) -4.
B) -3.
C) -2
D) -5.
E) -1.
Correct Answer:

Verified
Correct Answer:
Verified
Q71: Which type of graph is most useful
Q72: A normative statement<br>A)says what is currently believed
Q73: In order to determine whether to major
Q74: If whenever one variable increases, another variable
Q75: When Fresh Express Salads decides to mechanically
Q77: <img src="https://d2lvgg3v3hfg70.cloudfront.net/TB2787/.jpg" alt=" The graph shows
Q78: The marginal cost of an activity <sub>--------------------</sub>as
Q79: Whenever one variable increases, another variable decreases.
Q81: Which of the following is true regarding
Q143: The minimum point of a U-shaped curve,<br>A)