Multiple Choice
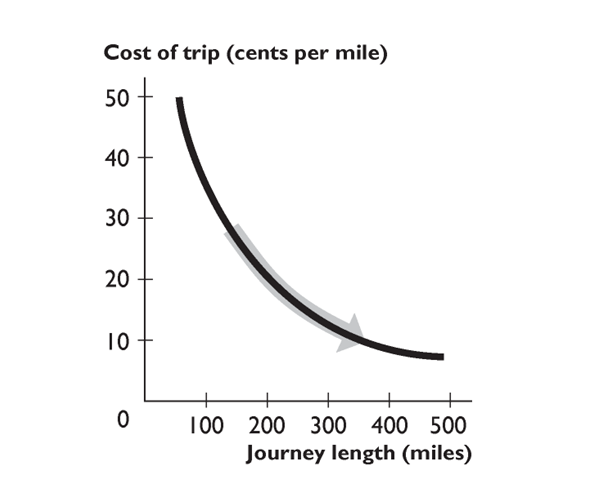
The figure above shows the relationship between the journey length and the cost of trip per mile. The curve becomes flatter because as the journey length increases,
A) the cost per mile decreases.
B) the cost per mile increases.
C) the cost per mile remains unchanged.
D) the fall in the cost per mile becomes smaller.
E) the fall in the cost per mile becomes greater.
Correct Answer:

Verified
Correct Answer:
Verified
Q12: Correlation means<br>A)other things remaining the same.<br>B)"on the
Q13: Will, Bill, and Phil decide to study
Q14: Your economics professor offers 10 points extra
Q15: Which of the following statements is correct?<br>A)When
Q16: Suppose the relationship between a person's age
Q18: <img src="https://d2lvgg3v3hfg70.cloudfront.net/TB2787/.jpg" alt=" What is the
Q19: You have data for sales of pizza
Q20: Scarcity<br>A)applies only to people living in poverty.<br>B)is
Q21: Which of the following is a microeconomic
Q22: <img src="https://d2lvgg3v3hfg70.cloudfront.net/TB2787/.jpg" alt=" In the figure