Multiple Choice
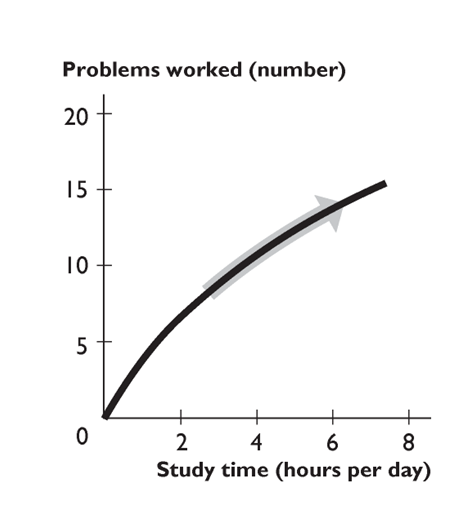
The figure above shows the relationship between study time and the number of problems worked. The curve becomes less steep because as you study more,
A) study time becomes more effective.
B) the relationship between study time and the number of problems worked changes from direct to inverse.
C) study time becomes less effective.
D) the number of problems worked decreases.
E) the number of problems worked increases.
Correct Answer:

Verified
Correct Answer:
Verified
Q3: A graph shows the average wage of
Q4: A rational choice is one that<br>A)always turns
Q5: A cross-section graph<br>A)is divided into different sections.<br>B)measures
Q6: <img src="https://d2lvgg3v3hfg70.cloudfront.net/TB2787/.jpg" alt=" In the above,
Q7: A time series graph<br>A)is similar to a
Q9: Of the three major economic questions, which
Q10: Economists measure opportunity cost<br>A)as the sum of
Q11: Increasing income tax rates will solve the
Q12: Correlation means<br>A)other things remaining the same.<br>B)"on the
Q13: Will, Bill, and Phil decide to study