Multiple Choice
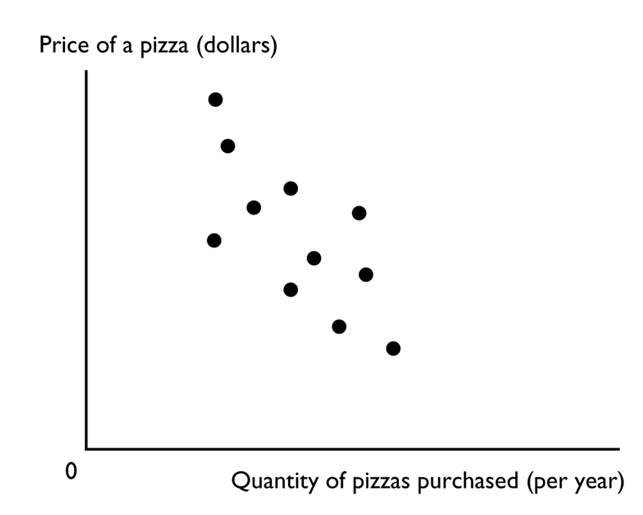
The figure above shows a
A) cross-section graph.
B) scatter diagram.
C) time-series graph.
D) trend diagram
E) slope.
Correct Answer:

Verified
Correct Answer:
Verified
Related Questions
Q123: Consider a diagram in which the variable
Q124: The slope of a line equals the
Q125: Which of the following statements is a
Q126: You have chosen to take a trip
Q127: A positive statement<br>I. makes a statement about
Q129: Microeconomics includes the study of<br>A)how countries decide
Q130: John has two hours of free time
Q131: A time-series graph displays the price of
Q132: On a graph showing the relationship between
Q133: The cost of a one-unit increase in