Multiple Choice
-
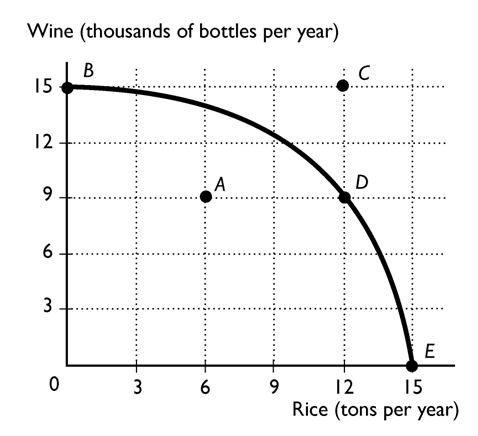
The above figure shows the production possibility frontier for a country. What is the opportunity cost to move from point D to point B?
A) 6 thousand bottles of wine
B) 9 thousand bottles of wine
C) 15 thousand bottles of wine
D) 12 tons of rice
E) Nothing, it is a free lunch
Correct Answer:

Verified
Correct Answer:
Verified
Q65: The production possibilities frontier is a graph
Q66: In the production possibilities frontier model, an
Q67: <img src="https://d2lvgg3v3hfg70.cloudfront.net/TB2787/.jpg" alt=" - The
Q68: If an economy cannot produce more of
Q69: <img src="https://d2lvgg3v3hfg70.cloudfront.net/TB2787/.jpg" alt=" - The figure
Q71: <img src="https://d2lvgg3v3hfg70.cloudfront.net/TB2787/.jpg" alt=" - In the
Q72: <span class="ql-formula" data-value="\begin{array} { c c c
Q73: <img src="https://d2lvgg3v3hfg70.cloudfront.net/TB2787/.jpg" alt=" - Suppose that
Q74: The production possibilities frontier illustrates the<br>A)maximum combinations
Q75: <img src="https://d2lvgg3v3hfg70.cloudfront.net/TB2787/.jpg" alt=" The