Multiple Choice
Figure 9-8.On the diagram below,Q represents the quantity of cars and P represents the price of cars. 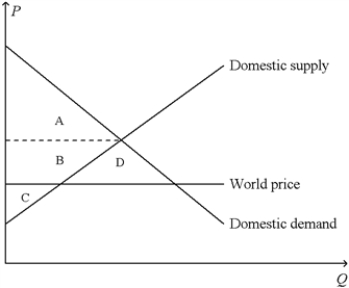
-Refer to Figure 9-8.The country for which the figure is drawn
A) has a comparative advantage relative to other countries in the production of cars and it will export cars.
B) has a comparative advantage relative to other countries in the production of cars and it will import cars.
C) has a comparative disadvantage relative to other countries in the production of cars and it will export cars.
D) has a comparative disadvantage relative to other countries in the production of cars and it will import cars.
Correct Answer:

Verified
Correct Answer:
Verified
Q117: Figure 9-6 <img src="https://d2lvgg3v3hfg70.cloudfront.net/TB7555/.jpg" alt="Figure 9-6
Q181: When a country that imports a particular
Q182: Figure 9-12 <img src="https://d2lvgg3v3hfg70.cloudfront.net/TB2297/.jpg" alt="Figure 9-12
Q183: Figure 9-2<br>The figure illustrates the market for
Q184: When a country allows trade and becomes
Q186: When a country that imports a particular
Q187: When a country allows international trade and
Q188: Figure 9-14.On the diagram below,Q represents the
Q189: Figure 9-8.On the diagram below,Q represents the
Q190: Suppose France imposes a tariff on wine