Multiple Choice
Figure 9-8.On the diagram below,Q represents the quantity of cars and P represents the price of cars. 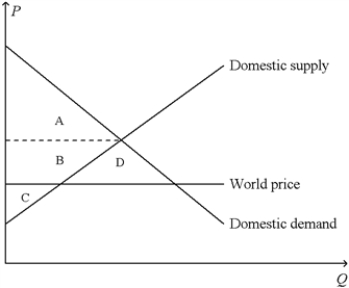
-Refer to Figure 9-8.When the country for which the figure is drawn allows international trade in cars,
A) consumer surplus increases by the area B.
B) producer surplus decreases by the area B + D.
C) total surplus increases by the area D.
D) All of the above are correct.
Correct Answer:

Verified
Correct Answer:
Verified
Q151: Figure 9-15 <img src="https://d2lvgg3v3hfg70.cloudfront.net/TB2297/.jpg" alt="Figure 9-15
Q152: Figure 9-2<br>The figure illustrates the market for
Q153: Figure 9-17 <img src="https://d2lvgg3v3hfg70.cloudfront.net/TB2297/.jpg" alt="Figure 9-17
Q154: Denmark is an importer of computer chips,taking
Q155: Figure 9-17 <img src="https://d2lvgg3v3hfg70.cloudfront.net/TB2297/.jpg" alt="Figure 9-17
Q157: Figure 9-7.The figure applies to the nation
Q158: Figure 9-1<br>The figure illustrates the market for
Q159: Figure 9-9 <img src="https://d2lvgg3v3hfg70.cloudfront.net/TB2297/.jpg" alt="Figure 9-9
Q160: Figure 9-15 <img src="https://d2lvgg3v3hfg70.cloudfront.net/TB2297/.jpg" alt="Figure 9-15
Q161: When,in our analysis of the gains and