Multiple Choice
Figure 9-8.On the diagram below,Q represents the quantity of cars and P represents the price of cars. 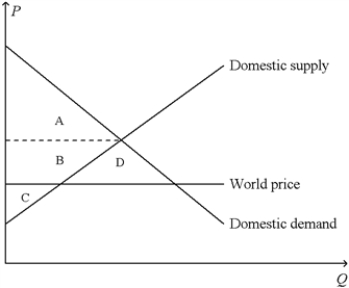
-Refer to Figure 9-8.In the country for which the figure is drawn,total surplus with international trade in cars
A) is represented by the area A + B + C.
B) is represented by the area A + B + D.
C) is smaller than producer surplus without international trade in cars.
D) is larger than total surplus without international trade in cars.
Correct Answer:

Verified
Correct Answer:
Verified
Q218: Figure 9-14.On the diagram below,Q represents the
Q219: Figure 9-21<br>The following diagram shows the domestic
Q220: Honduras is an importer of goose-down pillows.The
Q221: Figure 9-6<br>The figure illustrates the market for
Q222: Figure 9-5<br>The figure illustrates the market for
Q224: When a country abandons a no-trade policy,adopts
Q225: When a country allows trade and becomes
Q226: Figure 9-15 <img src="https://d2lvgg3v3hfg70.cloudfront.net/TB2297/.jpg" alt="Figure 9-15
Q227: Suppose Iran imposes a tariff on lumber.For
Q228: Figure 9-17 <img src="https://d2lvgg3v3hfg70.cloudfront.net/TB2297/.jpg" alt="Figure 9-17