Multiple Choice
Figure 9-14.On the diagram below,Q represents the quantity of crude oil and P represents the price of crude oil. 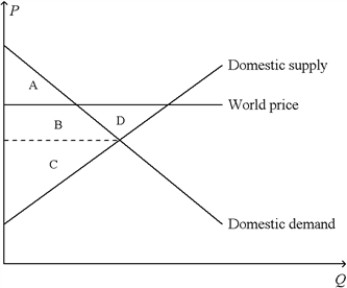
-Refer to Figure 9-14.The country for which the figure is drawn
A) has a comparative advantage relative to other countries in the production of crude oil and it will export crude oil.
B) has a comparative advantage relative to other countries in the production of crude oil and it will import crude oil.
C) has a comparative disadvantage relative to other countries in the production of crude oil and it will export crude oil.
D) has a comparative disadvantage relative to other countries in the production of crude oil and it will import crude oil.
Correct Answer:

Verified
Correct Answer:
Verified
Q144: Figure 9-9 <img src="https://d2lvgg3v3hfg70.cloudfront.net/TB2297/.jpg" alt="Figure 9-9
Q145: Figure 9-9 <img src="https://d2lvgg3v3hfg70.cloudfront.net/TB2297/.jpg" alt="Figure 9-9
Q146: When,in our analysis of the gains and
Q147: Figure 9-3.The domestic country is China. <img
Q148: Figure 9-21<br>The following diagram shows the domestic
Q150: Figure 9-26<br>The diagram below illustrates the market
Q151: Figure 9-15 <img src="https://d2lvgg3v3hfg70.cloudfront.net/TB2297/.jpg" alt="Figure 9-15
Q152: Figure 9-2<br>The figure illustrates the market for
Q153: Figure 9-17 <img src="https://d2lvgg3v3hfg70.cloudfront.net/TB2297/.jpg" alt="Figure 9-17
Q154: Denmark is an importer of computer chips,taking