Multiple Choice
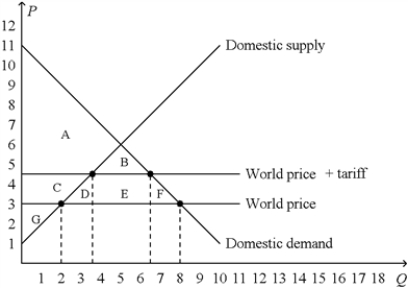
Figure 9-16.The figure below illustrates a tariff.On the graph,Q represents quantity and P represents price. 
-Refer to Figure 9-16.The area C + D + E + F represents
A) the decrease in consumer surplus caused by the tariff.
B) the decrease in total surplus caused by the tariff.
C) the deadweight loss of the tariff minus government revenue raised by the tariff.
D) the deadweight loss of the tariff plus government revenue raised by the tariff.
Correct Answer:

Verified
Correct Answer:
Verified
Q21: When the nation of Worldova allows trade
Q46: Figure 9-11 <img src="https://d2lvgg3v3hfg70.cloudfront.net/TB2297/.jpg" alt="Figure 9-11
Q47: Figure 9-20<br>The figure illustrates the market for
Q48: When a country that imports a particular
Q49: When a country allows trade and becomes
Q50: Figure 9-22<br>The following diagram shows the domestic
Q52: Figure 9-17 <img src="https://d2lvgg3v3hfg70.cloudfront.net/TB2297/.jpg" alt="Figure 9-17
Q53: Suppose Iceland goes from being an isolated
Q54: Suppose Iceland goes from being an isolated
Q55: If Freedonia changes its laws to allow