Multiple Choice
Figure 9-18.On the diagram below,Q represents the quantity of peaches and P represents the price of peaches.The domestic country is Isoland. 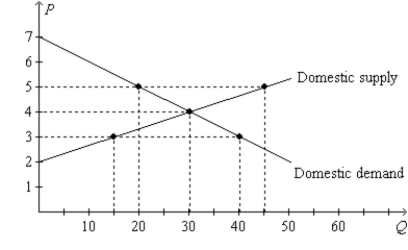
-Refer to Figure 9-18.Suppose Isoland changes from a no-trade policy to a policy that allows international trade.If the world price of peaches is $3,then the policy change results in a
A) $15.00 decrease in producer surplus.
B) $45.00 increase in consumer surplus.
C) $20.00 increase in total surplus.
D) $12.50 increase in total surplus.
Correct Answer:

Verified
Correct Answer:
Verified
Q57: When the nation of Duxembourg allows trade
Q238: Figure 9-25<br>The following diagram shows the domestic
Q239: When a country allows trade and becomes
Q240: A tariff<br>A)lowers the domestic price of the
Q241: Figure 9-2<br>The figure illustrates the market for
Q242: Figure 9-17 <img src="https://d2lvgg3v3hfg70.cloudfront.net/TB2297/.jpg" alt="Figure 9-17
Q244: Figure 9-10.The figure applies to Mexico and
Q245: A major difference between tariffs and import
Q246: Figure 9-16.The figure below illustrates a tariff.On
Q247: Some goods can be produced at low