Multiple Choice
Figure 9-24
The following diagram shows the domestic demand and supply in a market.Assume that the world price in this market is $20 per unit. 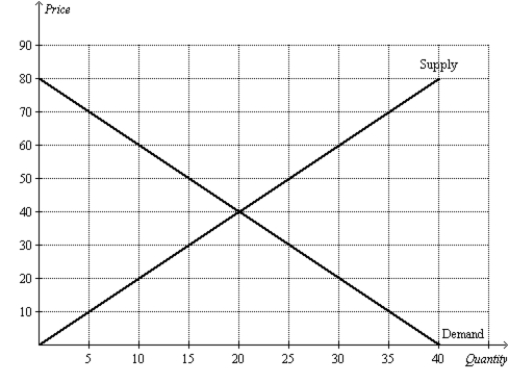
-Refer to Figure 9-24.Suppose the government imposes a tariff of $10 per unit.The amount of revenue collected by the government from the tariff is
A) $50.
B) $100.
C) $150.
D) $200.
Correct Answer:

Verified
Correct Answer:
Verified
Q171: In analyzing the gains and losses from
Q289: Figure 9-5<br>The figure illustrates the market for
Q290: When a country abandons a no-trade policy,adopts
Q291: Scenario 9-1<br>The before-trade domestic price of peaches
Q292: Figure 9-9 <img src="https://d2lvgg3v3hfg70.cloudfront.net/TB2297/.jpg" alt="Figure 9-9
Q295: Figure 9-20<br>The figure illustrates the market for
Q296: If Freedonia changes its laws to allow
Q297: Figure 9-18.On the diagram below,Q represents the
Q298: Relative to a situation in which domestic
Q299: The United States has imposed taxes on