Essay
Tammy loves donuts. The table shown reflects the value Tammy places on each donut she eats: 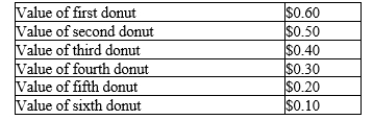
a.Use this information to construct Tammy's demand curve for donuts.
b.If the price of donuts is $0.20, how many donuts will Tammy buy?
c.Show Tammy's consumer surplus on your graph. How much consumer surplus would she have at a price of $0.20?
d.If the price of donuts rose to $0.40, how many donuts would she purchase now? What would happen to Tammy's consumer surplus? Show this change on your graph.
Correct Answer:

Verified
a.  b.At a price of $0.20, Tammy would b...
View Answer
Unlock this answer now
Get Access to more Verified Answers free of charge
Correct Answer:
Verified
View Answer
Unlock this answer now
Get Access to more Verified Answers free of charge
Q25: Figure 7-15 <img src="https://d2lvgg3v3hfg70.cloudfront.net/TB2297/.jpg" alt="Figure 7-15
Q28: Figure 7-1 <img src="https://d2lvgg3v3hfg70.cloudfront.net/TB2297/.jpg" alt="Figure 7-1
Q43: Consumer surplus<br>A)is closely related to the supply
Q46: Figure 7-8 <img src="https://d2lvgg3v3hfg70.cloudfront.net/TB2297/.jpg" alt="Figure 7-8
Q68: Inefficiency exists in an economy when a
Q101: Figure 7-28 <img src="https://d2lvgg3v3hfg70.cloudfront.net/TB2297/.jpg" alt="Figure 7-28
Q119: Figure 7-21 <img src="https://d2lvgg3v3hfg70.cloudfront.net/TB2297/.jpg" alt="Figure 7-21
Q128: Table 7-8<br>During the last two days, Chad
Q142: The area below the demand curve and
Q504: Table 7-5<br>For each of three potential buyers