Multiple Choice
Figure 5-14 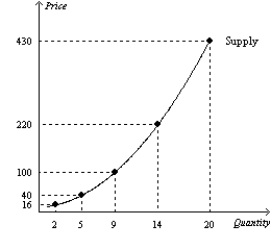
-Refer to Figure 5-14.Using the midpoint method,what is the price elasticity of supply between $100 and $220?
A) 0.58
B) 0.67
C) 1.00
D) 1.73
Correct Answer:

Verified
Correct Answer:
Verified
Q52: An increase in the price of cheese
Q53: Figure 5-16 <img src="https://d2lvgg3v3hfg70.cloudfront.net/TB2297/.jpg" alt="Figure 5-16
Q54: Which of the following statements is not
Q55: If the price elasticity of supply is
Q56: Holding all other factors constant and using
Q58: Figure 5-14 <img src="https://d2lvgg3v3hfg70.cloudfront.net/TB2297/.jpg" alt="Figure 5-14
Q59: Figure 5-17 <img src="https://d2lvgg3v3hfg70.cloudfront.net/TB2297/.jpg" alt="Figure 5-17
Q60: The price elasticity of supply measures how
Q61: If the quantity supplied is the same
Q159: The price elasticity of supply measures how