Multiple Choice
Table 5-4
The following table shows the demand schedule for a particular good. 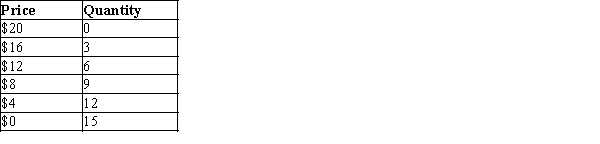
-Refer to Table 5-4. Using the midpoint method, when price rises from $8 to $12, the price elasticity of demand is
A) 0.4
B) 1
C) 1.5
D) 2.33
Correct Answer:

Verified
Correct Answer:
Verified
Q8: Suppose the price elasticity of supply for
Q25: If a 30 percent change in price
Q55: If the cross-price elasticity of demand for
Q63: Figure 5-4 <img src="https://d2lvgg3v3hfg70.cloudfront.net/TB2297/.jpg" alt="Figure 5-4
Q80: Income elasticity of demand measures how<br>A)the quantity
Q87: The measure of how willing consumers are
Q147: Scenario 5-4<br><br>Consider the markets for mobile and
Q160: Figure 5-2 <img src="https://d2lvgg3v3hfg70.cloudfront.net/TB2297/.jpg" alt="Figure 5-2
Q204: Figure 5-5 <img src="https://d2lvgg3v3hfg70.cloudfront.net/TB2297/.jpg" alt="Figure 5-5
Q400: Table 5-4<br>The following table shows the demand